
Every L&D leader knows the moment. The program is live, learners are clicking through, certificates are piling up. Then someone in finance asks, "What did we get for that budget?"
Too often, the answer is a stack of completion rates and satisfaction scores. That isn't measurement. It's hope wearing a dashboard.
Measuring training ROI isn't mysterious. Most teams track the wrong things, or track the right things in a way no one outside L&D understands. This guide covers the metrics worth tracking, how to connect them to business outcomes, and how to build a measurement habit that doesn't overwhelm your team.
Why Most Training ROI Calculations Miss the Mark
The Completion Trap
Completion shows that learners clicked through the course. It doesn't show that anyone learned anything. A 95% completion rate on mandatory compliance training can just as easily mean people skipped ahead while checking email.
The Reaction Fog
"Did you enjoy the course?" isn't a business outcome, yet it's one of the most commonly reported metrics. Enjoyment supports engagement, but it says little about behavior change or results.
The Isolation Problem
Training data often sits in its own silo. Even with good metrics, L&D can't link them to sales, retention, or efficiency, and finance doesn't speak "completion rate."
The Lag Effect
Impact rarely shows up right away. A new skill may take 30, 60, or 90 days to turn into a measurable result, and most measurement cycles end before that window opens.
If this sounds familiar, you're not failing at L&D. You're working with a reporting habit built for an earlier era.
The Four Levels of Training Measurement
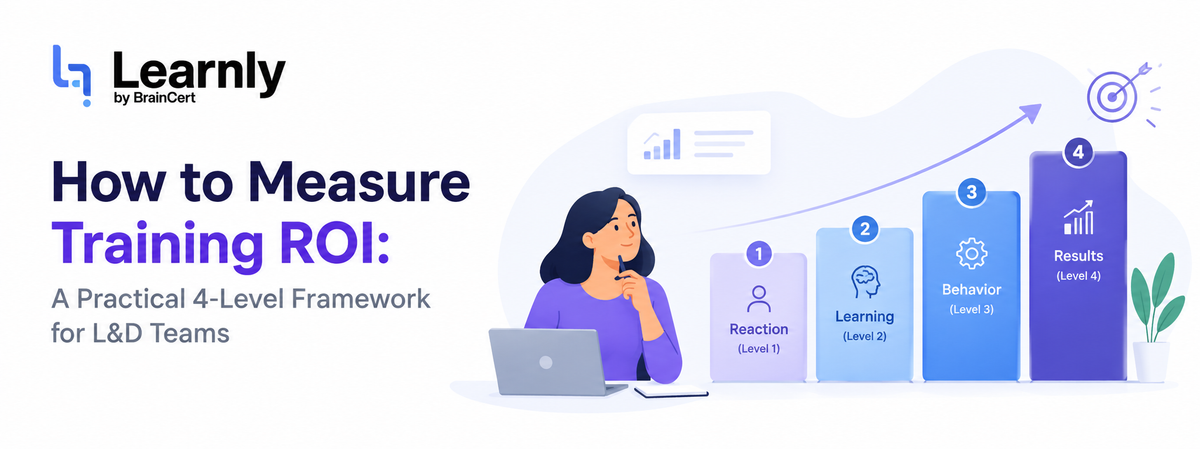
The framework below is adapted from Kirkpatrick's four levels of training evaluation and the Phillips ROI approach. Rather than tracking everything, it focuses on a set of metrics across four levels: engagement, learning, behavior change, and business impact. Skip a level, and you're guessing.
Level 1: Engagement (the foundation)
Engagement tells you whether training can work.
- Active learner rate: The percentage of enrolled learners who take at least one meaningful action within the first 14 days. It separates real participation from ignored assignments.
- Time on task vs. expected duration: If a 20-minute course takes learners four minutes, either the content is too easy, or people are skimming.
- A forward-looking reaction question: Instead of "Did you like it?", ask "How likely are you to apply this in the next week?"
Example (hypothetical): A support team finishes new product training with 94% completion, but median time on task is only 40% of the expected duration. The instructor re-records three sections with clearer examples, and the team re-checks engagement two weeks later.
Level 2: Learning (proof of knowledge)
Engagement without learning is just attendance.
- Pre/post assessment change: Compare scores before and after training to see actual knowledge gain.
- Skill confidence scores: Measure self-reported confidence right after training and again at 30 days. The drop-off shows where retention is slipping.
- Pass rates on competency assessments: For certifications and compliance roles, these are essential. Set targets by comparing against your own past cohorts.
- Question-level results: Seeing which concepts learners miss lets you fix the content, not just report the score.
Level 3: Behavior change (the hard part)
This is where many teams stop, because behavior change is messy. It's also where the ROI lives.
- On-the-job application: Check at 30, 60, and 90 days through supervisor sign-off, peer observation, or work reviews.
- Quality and error indicators: Look at defect rates, handle times, rework or close rates, depending on the role.
- Supervisor-observed competency ratings: Short, regular check-ins where supervisors look for specific skills.
A quick test: for any program from the last 90 days, can you say what share of learners changed a behavior on the job? If not, you have a Level 3 gap.
Level 4: Business impact (the executive conversation)
These numbers earn L&D a seat in strategy discussions. They take patience, baseline data, and partnership with other teams.
- Time to proficiency: How quickly new hires reach full productivity. Even a modest, well-documented reduction is a strong story.
- Retention in targeted roles: Compare voluntary turnover among people who received upskilling with a comparable group.
- Revenue or productivity per trained employee: Most useful for sales and customer-facing teams.
- Cost avoidance: Compliance errors, safety incidents, or churn prevented. It's harder to quantify, but it carries weight when the method is credible.
Don't claim credit for everything. Use a control group where you can, or track the same metric in a comparable team that didn't take the training.
How to Connect Training Data to Business Outcomes
You don't need a data science team, but you do need three things.
- A baseline. Capture the business metric before launch. Without it, you can't show movement.
- A conservative attribution approach. Training is rarely the only reason a number moves. Estimate the share that's truly due to training, ideally using a control group or stakeholder input, and be transparent about your assumptions.
- A dashboard that speaks two languages. Show engagement and learning data to your L&D team, and show outcomes in the language of operations and finance.
Calculate the Return on Your Training Investment
When you're ready to calculate ROI, use the standard formula below:
Monetary benefits − costs
Total cost of the training program
Where Learnly fits. The hardest gap to close is between "they finished" and "they can do the job." Learnly is built for that gap. Its AI-driven skill assessments, competency dashboards, readiness scoring, and learning transfer analytics help you verify real skills rather than course completions, giving you the Level 2 and Level 3 evidence that Level 4 conversations depend on.
Build a Measurement Framework You Can Maintain
Start small. Pick one program and three metrics, one each from Levels 1–3. Run it for a full quarter or two, then expand.
- Quarter 1: Baseline engagement and learning metrics for your top three programs.
- Quarter 2: Add behavior tracking through supervisor check-ins on one pilot program.
- Quarter 3: Link to a business metric with finance or operations as a partner.
- Quarter 4: Retire metrics that aren't informing decisions, and keep the ones that are.
The goal isn't a perfect dashboard. It's a habit that compounds.
Common Pitfalls That Undermine L&D Credibility
Common Pitfalls That Undermine L&D Credibility
Even good training programs can lose credibility when measurement focuses on the wrong questions.
Reporting Vanity Metrics to Executives
Completion rates are a hygiene metric, not a value metric. Executives need to understand what changed because of the training and how that change connects to business outcomes.
Ignoring the Cost Side
A program that generates benefits still needs to be evaluated against what it costs. If a program costs $500K and delivers $300K in benefits, the ROI is:
Say so, then decide whether the program needs to be improved or retired.
Measuring Too Much, Too Soon
More metrics don't automatically mean better measurement. Start with the smallest useful set of metrics, then expand as you learn what actually helps explain training impact.
Letting the Tool Dictate the Questions
L&D should define what it needs to know first. The tools should then serve those questions, rather than forcing the measurement strategy around whatever data the platform happens to make available.

Make Measurement a Habit, Not a Project
The L&D teams that win the ROI conversation aren't the ones with the fanciest dashboards. They treat measurement as an ongoing practice, the way sales teams treat pipeline reviews.
Start with engagement, prove learning, track behavior, and connect to business results, in that order. Do that consistently and you stop being seen as a cost center and start being seen as a strategic partner.
That's what workforce readiness looks like: capability, not just certificates, and confidence, not just completion.